A railway line,
measured from the cloud
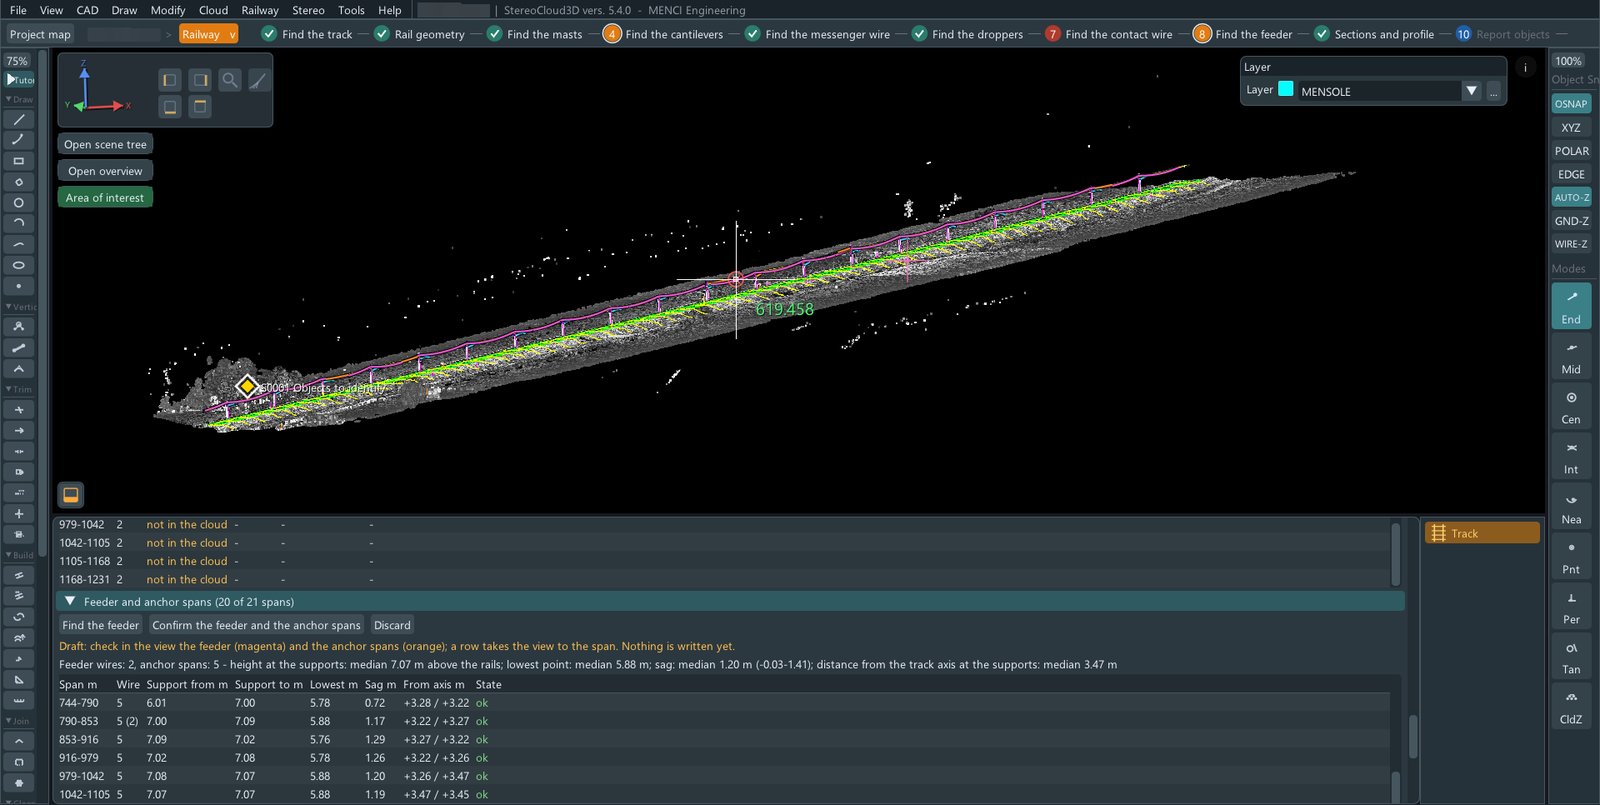
An aerial LiDAR survey of a double-track electrified line. No drawing to start from: the program finds the track, measures it every two metres and rebuilds the overhead line span by span. The operator checks every proposal, confirms, and only then is anything written.
This is one example. The same way of working, proposal first and confirmation after, applies to buildings, power lines, roads, bridges and tunnels.
- 1.3 kmof corridor
- 1286stations measured
- 104masts found
- 19 of 19messenger spans
The data say what can be done
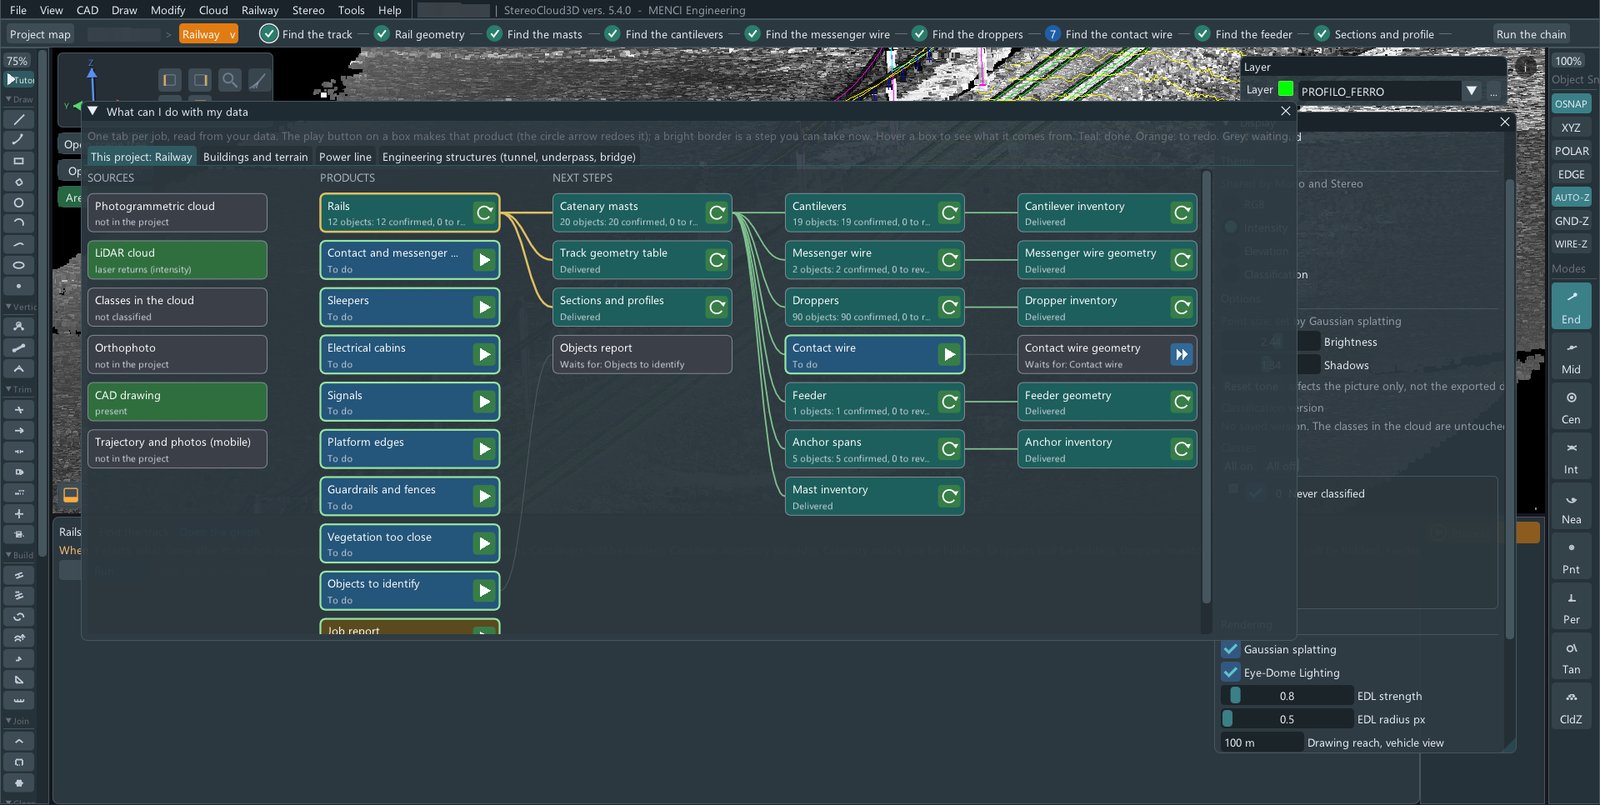
Before any tool is opened, the project reads what it holds: a LiDAR cloud and a CAD drawing, no orthophoto, no classes. From that it lays out the products of a railway job and the order they come in: rails, track geometry table, masts, cantilevers, messenger wire, droppers, feeder, anchor spans, sections. Each box shows whether it is still to do, a draft, or delivered.
Find the track
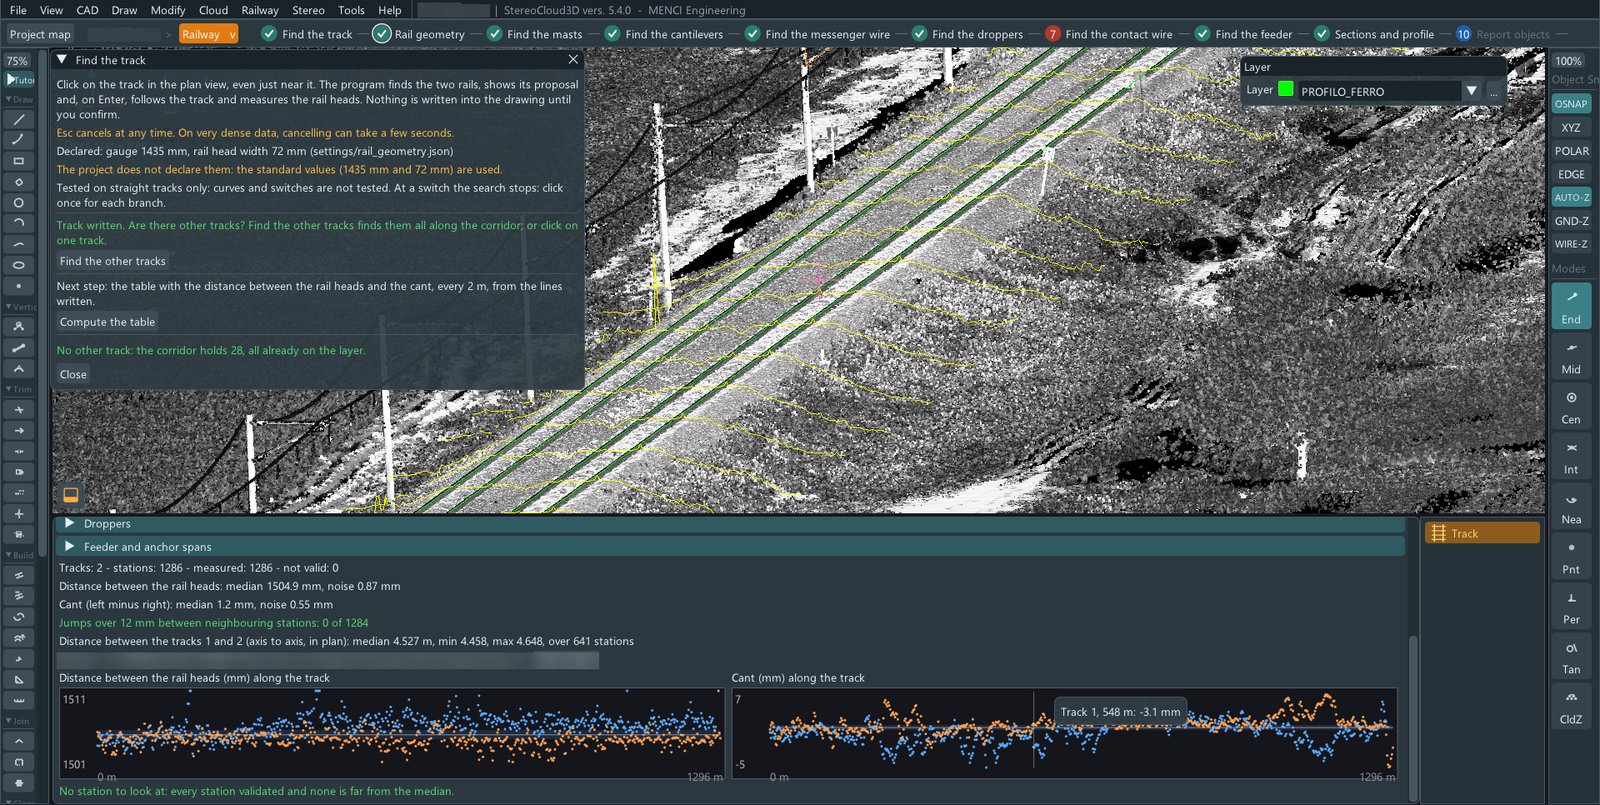
A click near the track is enough. The program finds the two rails, shows its proposal, and on confirmation follows the track along the corridor and measures the rail heads. It states what it assumes: here the project did not declare a gauge, so the standard 1435 mm and 72 mm rail head were used, and it says so.
The track table, every two metres
Two tracks, 1286 stations, all measured. Distance between the rail heads: median 1504.9 mm, with 0.87 mm of noise. Cant: median 1.2 mm. No jump over 12 mm between neighbouring stations. The two curves along the track show where to look, and here there is nothing to look at.
The masts, with an honest count
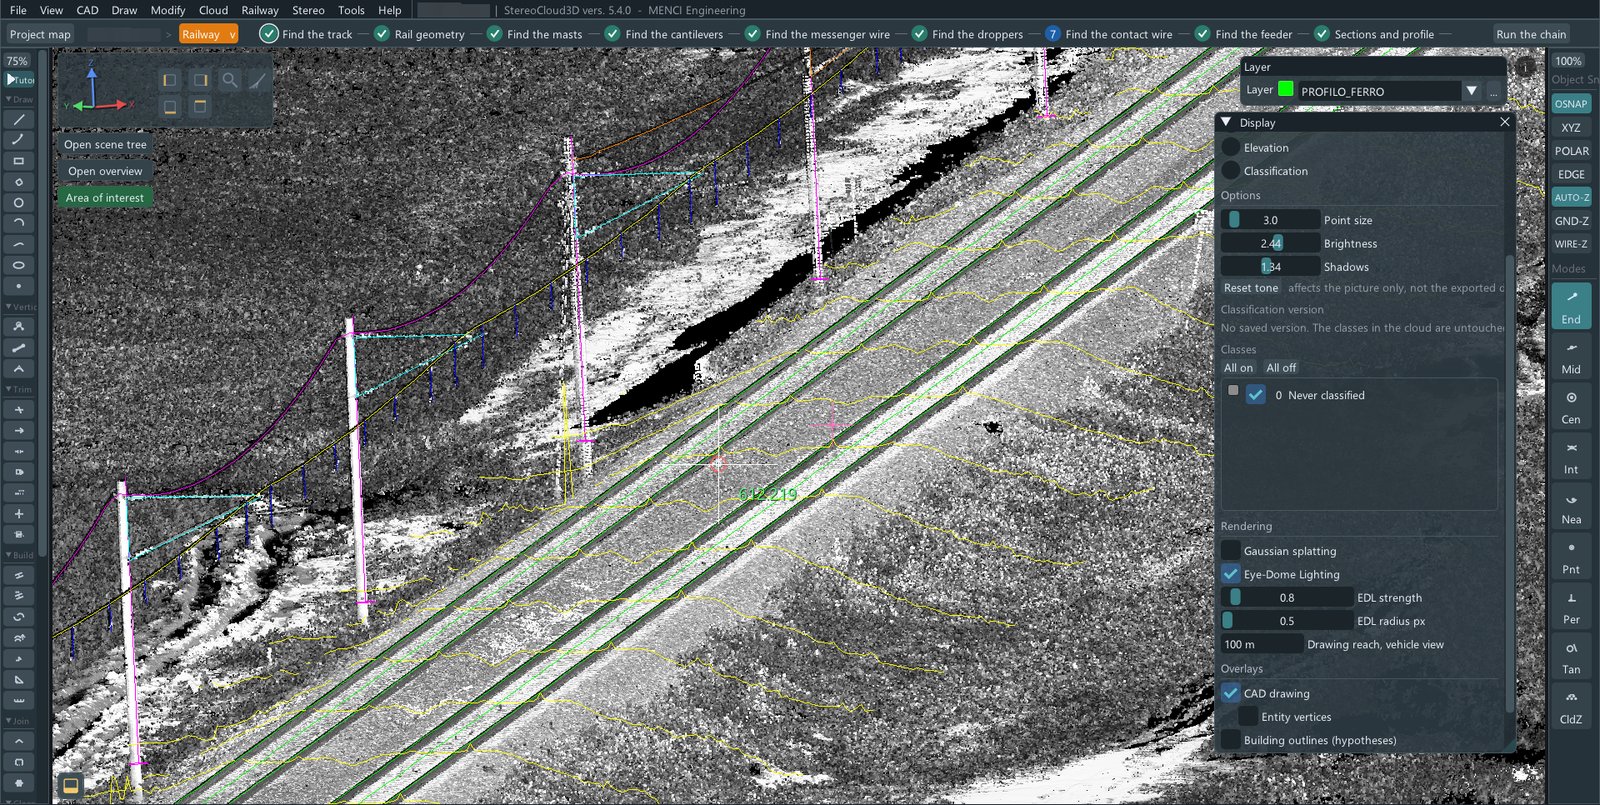
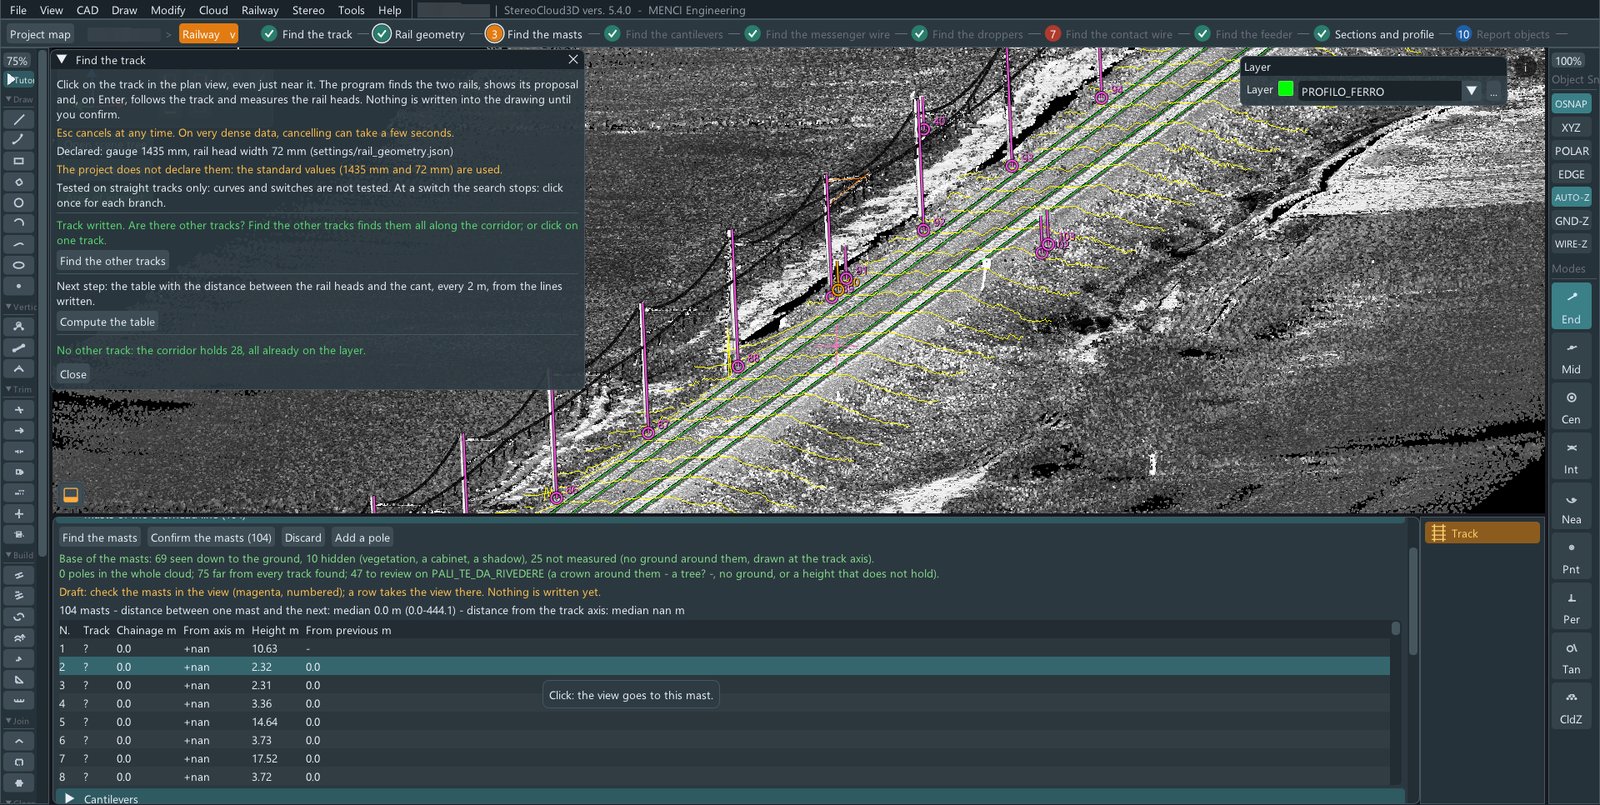
104 masts along the corridor. 69 are seen down to the ground; for the others the program says why not: hidden by vegetation, a cabinet or a shadow, or no ground around them. The draft is drawn in magenta and numbered; a row of the table takes the view to that mast. Nothing is written yet.
The messenger wire, span by span
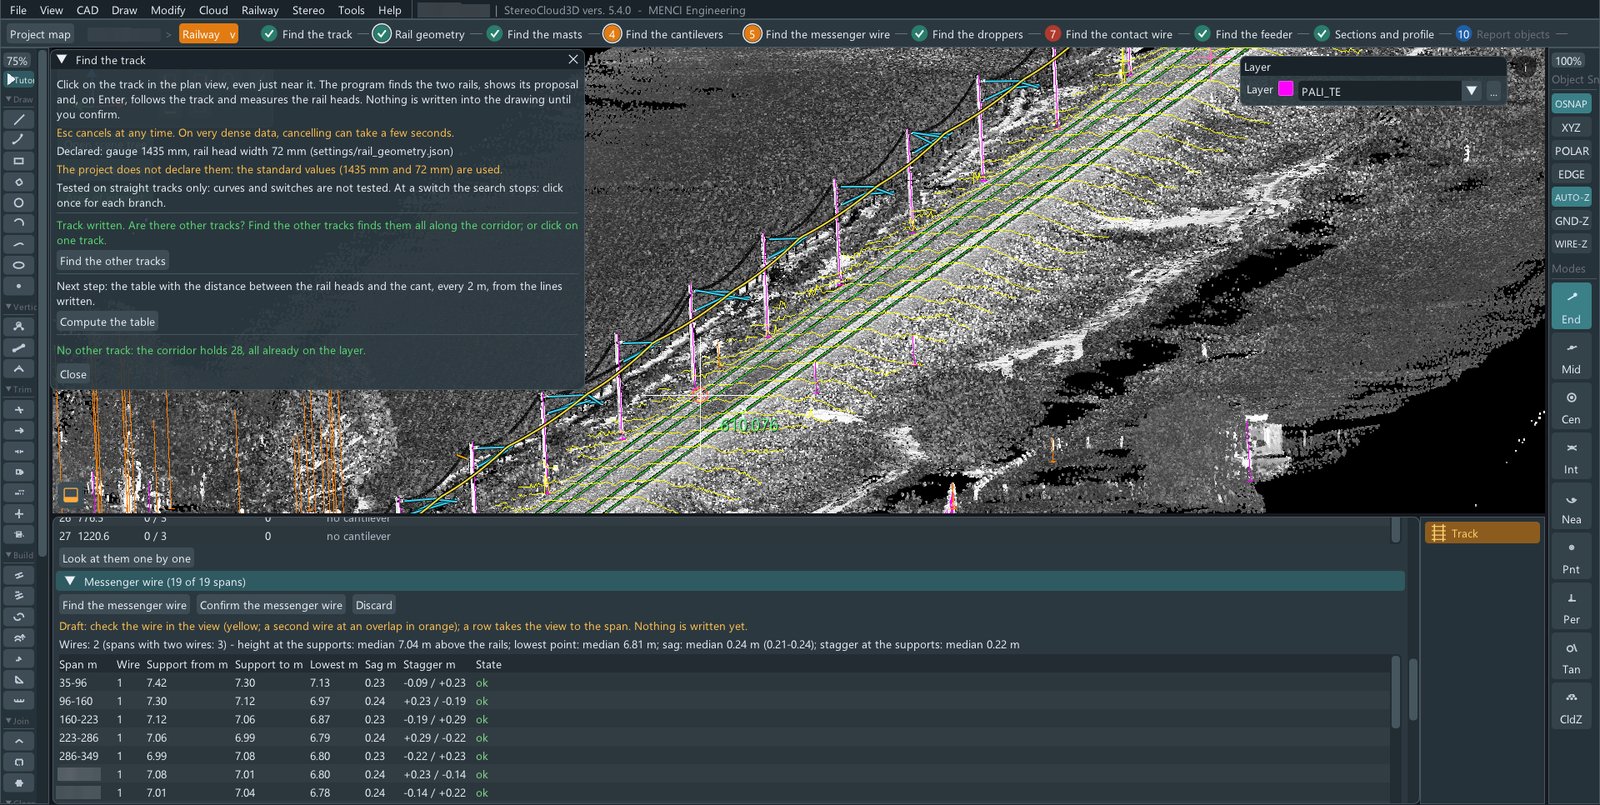
19 spans out of 19. Height at the supports: median 7.04 m above the rails; sag 0.24 m; stagger 0.22 m. Every span is checked against its neighbours and marked: here all are in order.
What the cloud does not hold, it says
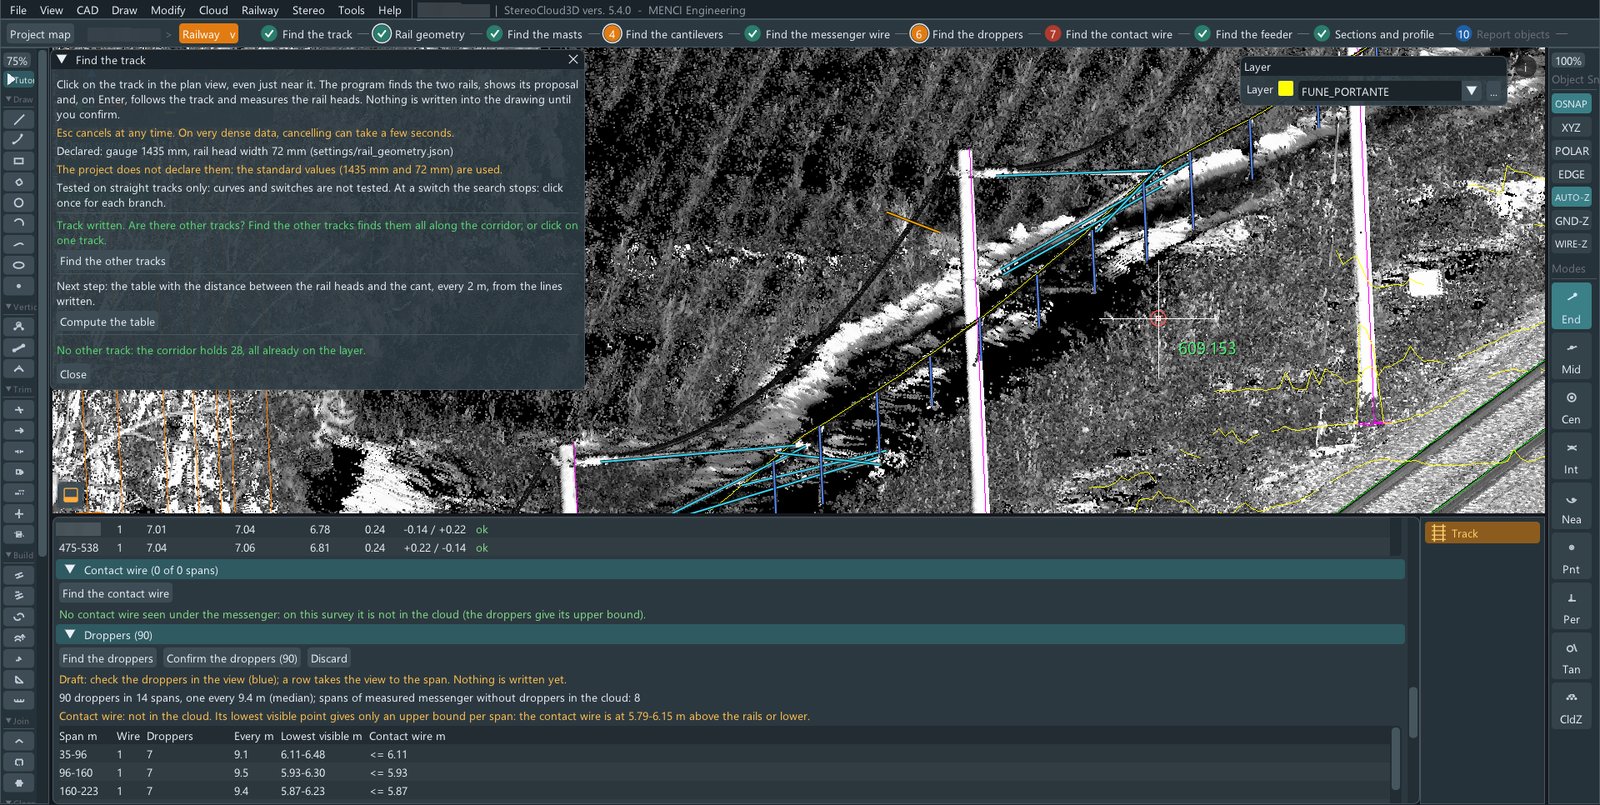
90 droppers in 14 spans, one every 9.4 m. The contact wire is not in this survey: the program does not invent it. It says so, and gives the bound it can prove, the lowest visible point of each span.
Checked, piece by piece
Before anything is written, each mast, each span, each cantilever is looked at against the points it came from: in mono, with the loupe and Multiview, or in stereo for those who use it. A wire that hangs right in the table but sits on the wrong side of the mast is seen at once. What is confirmed goes into the drawing; what is not, stays a draft.
The whole line, drawn
Rails, masts, cantilevers, wires: confirmed piece by piece, written to the drawing, ready for the sections and the profile, and for the tables that go with the delivery.